

Access advice to guide your steps
Every time the RBA lifts rates, someone tells me they paid 17%. They did. So who actually had it harder?
The RBA lifted the cash rate to 4.85% on 3 November 2026, the highest since November 2008. The 17% people remember from 1989–90 was a standard variable mortgage rate, which ran from June 1989 to March 1990. Mortgage rates sit a couple of points above the cash rate, so the fair comparison is 17% against roughly 6.7% today (an analyst estimate of the average mortgage rate after this rise), not 17% against 4.85%.
On the average new loan, repayments take a bigger slice of an average wage today than they did at the 1989 peak, even with a mortgage rate about ten points lower.
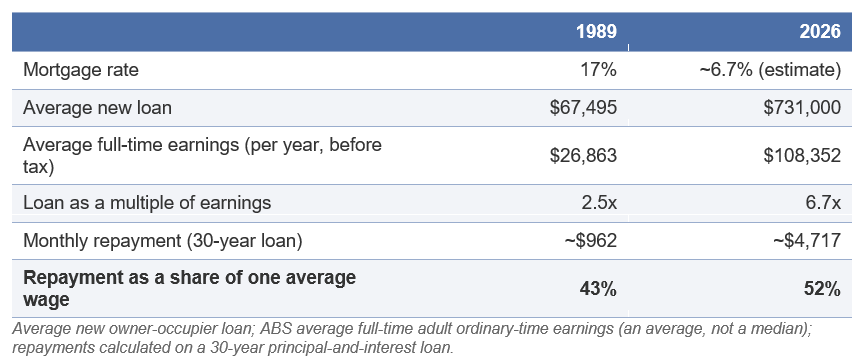
Put another way, today's average loan would cost the same share of an average wage as 1989's only if mortgage rates were about 4.9%.
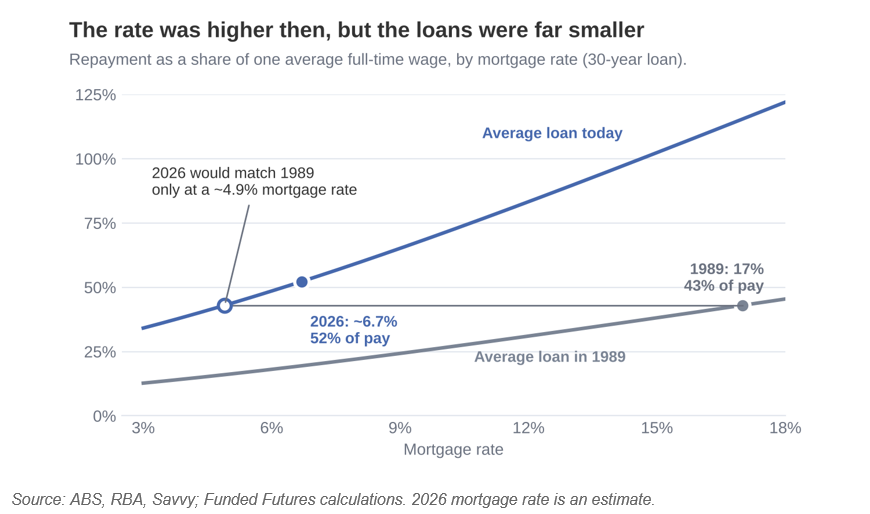
Average earnings are up roughly 50% in real terms since 1989, but the average loan is about four times larger in real terms. Wages have grown; debt has grown faster.
That shift is real, but it was already well underway by 1989. The ABS found that 47% of married-couple families had both partners employed in June 1991, and 52.5% of couples with dependent children did in June 1993 (the latter as reported by the Australian Institute of Family Studies).
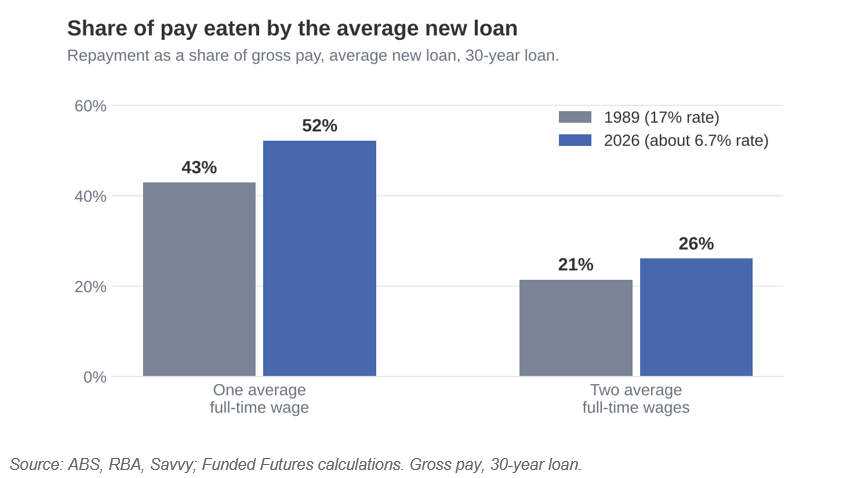
So the fair test is two wages against two wages. On two average full-time wages before tax, repayments on the average new loan take about 21% in 1989 terms and about 26% today. Setting today's two-income couple against a 1989 one-income couple makes today look lighter (26% vs 43%), but that flatters today, because roughly half of 1989-era couples had two incomes too.
Childcare is a real cost of the second income, but it isn't new, and the typical family pays less than the headlines suggest.
• The worst case: the ACCC's childcare inquiry found a family with two children in care five days a week faced out-of-pocket costs of 16% of after-tax income (reported in Australian National University PolicyMod analysis, 2023).
• The typical case: the same analysis put the average at about 4% of after-tax household income, with a median of around $2,400 a year.
• The stretched middle: the Mitchell Institute found about 39% of families using childcare spend more than 7% of household income on it, using HILDA survey data.
• The 1990s: Commonwealth department data released in 2006 showed gap fees for a child in full-time long day care took 10–13% of disposable income in 1996 for families earning $30,000–$80,000.
So childcare bites hardest on families with several children in full-time care, which is exactly when a second income is needed to carry the mortgage. But the data doesn't show it as a new penalty compared with the 1990s. What has changed is how many households depend on that second income.
Both camps have a case, and neither is as strong as it sounds.
• The older generation's case: 17% was real, and anyone who bought in the late-1980s boom saw repayments jump overnight. But it was brief: mortgage rates had fallen to about 9% within three years, and average full-time earnings were growing 6.6% a year (to November 1989), against 3.7% in the year to May 2026.
• The younger generation's case: the average loan is about four times larger in real terms, and houses cost about 10 times average earnings, up from about 6.5 times. The RBA has also left the door open to further rises.
• The fair adjustment: part of today's bigger loan buys a bigger home. The average new house has grown from 181 m² to 241.5 m², and two-car households have gone from 44.6% to 55.1%.
1989 was a sharper, shorter shock on small loans. Today is a longer squeeze on much larger ones, carried by two incomes that were already common back then.
If you're not sure how another rate rise would affect your budget, it's worth working that out before it happens. A financial adviser can look at your whole situation, not just the repayment.
Funded Futures Financial Services Socials






This website may contain general advice, but does not take into account your objectives, financial situation or needs. You should consider whether the advice is suitable for you and your personal circumstances. Before you make any decision about whether to acquire a certain product, you should obtain and read the relevant product disclosure statement. In the event that Funded Futures Financial Services is providing personal advice it will be communicated via a ‘statement of advice’.
Funded Futures Financial Planning ABN 81 646 656 804 T/A Funded Futures Financial Services is a Corporate Authorised Representatives and is authorised through Cobalt Advisers Pty Ltd ABN 64 628 654 099 who is an Australian Financial Services Licencee # 512550.
© 2024 Funded Futures | All Rights Reserved | Developed by
