



Access advice to guide your steps
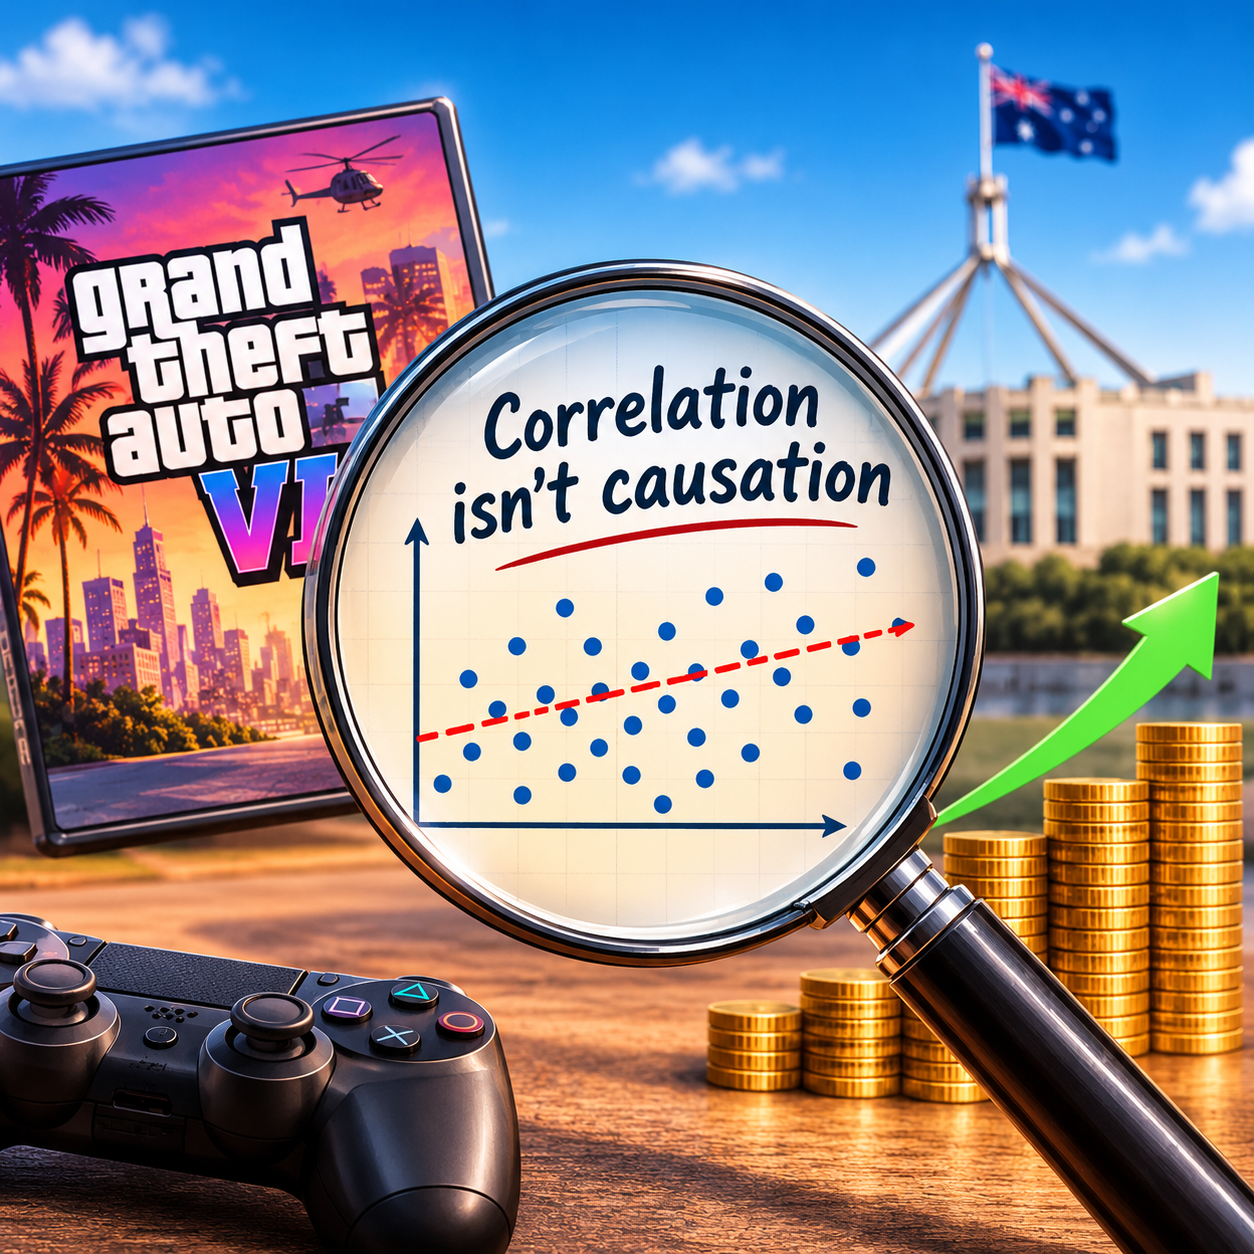
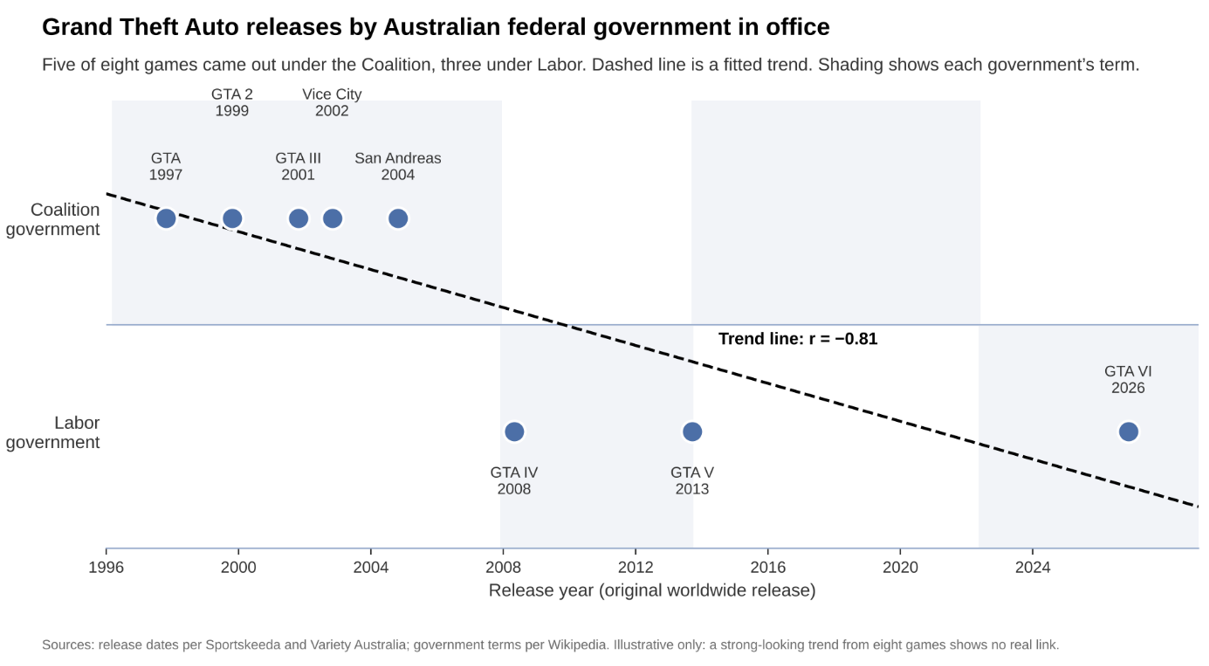
Australia has had more Grand Theft Auto under the Coalition: five of the eight games, against three under Labor. But IV, V and now VI all came out on Labor’s watch, so a trend is arguably under way. So what does that mean for GTA 7? It sounds like a finding. It isn’t one, and the reason is the most useful idea in investing: two things moving together doesn’t mean one is causing the other.
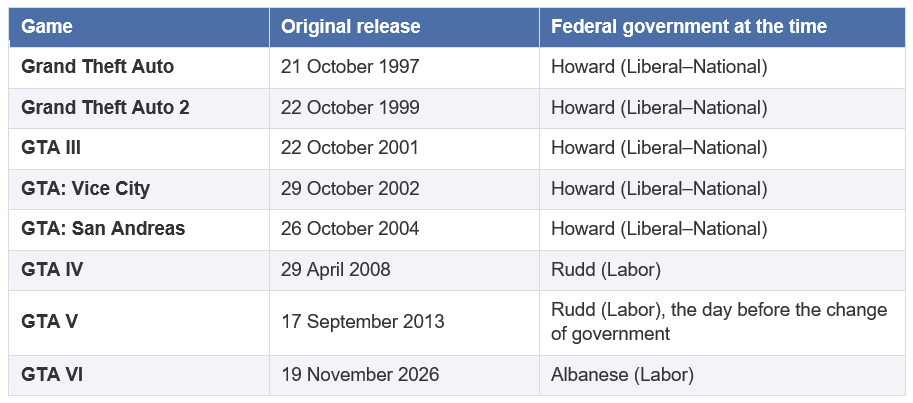
Run the same test the other way and you get “every GTA before 2008 came out under the Coalition”. Both statements are true and neither tells you anything. Eight games is a tiny sample, and the release dates were set by development schedules, not by Canberra. IV was first scheduled for October 2007, under Howard, then slipped to April 2008. V was pushed from spring 2013 to September to allow more polish. A few weeks either way changes the “result”.
Correlation is a measure of how closely two series move together. It is usually reported as a number between −1 and +1, called the correlation coefficient (r). Near +1, they rise and fall together. Near −1, one rises as the other falls. Near 0, there is no consistent link. Squaring it gives r², the share of the movement in one series that lines up with the other. A scatter plot shows the same thing visually: a tight diagonal band means a strong correlation.
That number says only that the two series have moved together in the data you looked at. It doesn’t say why.
• Coincidence. Search enough data and something will line up by chance. One well-known joke correlation pairs the number of films Nicolas Cage appears in with the number of people who drown in swimming pools.
• A hidden third factor (a confounder). A classic example is that people who move to Florida seem more likely to develop Alzheimer’s. The hidden factor is age. Older people both retire to Florida and develop Alzheimer’s more often, so Florida is not the cause.
• Reverse direction. Sometimes B causes A, or each feeds the other. Share prices and news headlines can work this way: headlines follow the market as much as they lead it.
Causation is a stronger claim, and it needs stronger evidence. Researchers use a few tools, and none of them is just a bigger correlation:
• Randomised controlled trials. Randomly split people into two groups and change one thing for only one group. Random allocation makes the groups alike in everything else.
• Natural experiments. Where a rule or event affects one group and not a comparable one, the difference can be studied without running a trial.
• Controlling for other factors. Regression analysis tries to hold the likely confounders constant to see whether the link survives.
• Bradford Hill’s criteria. In 1965 epidemiologist Austin Bradford Hill set out nine considerations for judging cause. They include the strength of the association, whether it shows up consistently in different settings, whether the cause comes before the effect, and whether there is a plausible mechanism. They are guides to judgement, not a pass mark.
In the 1990s, financial researcher David Leinweber went looking for the best predictor of the S&P 500. He found that butter production in Bangladesh tracked it closely, and adding US cheese production and sheep populations got the fit to about 99% over ten years. He did it as a joke, to show how data mining can produce a perfect-looking model from nonsense. He later said people still rang him asking for the latest butter figures.
The Super Bowl indicator is the best-known real example. It says that if a team from the original NFL (now the NFC) wins, the market rises that year, and if an AFC team wins, it falls. It has been right roughly 70% to 75% of the time over its history, and about 90% from 1967 to 1997. Since then its record has been much weaker. Market strategist Sam Stovall’s verdict is that it has correlation with no causation, because there is no reason a football result should move share prices.
Both examples fit the past well and have no mechanism. That is the warning sign. A pattern found by searching through history will often fail once it meets new data, because it only ever described the sample it was built from. The same applies to a strategy whose track record looks perfect, or an indicator that “has called every downturn”. Our earlier article on spotting downturns makes a related point: indicators that worked for decades can stop working, and the story that explains why they won’t matter this time is the part to be sceptical about.
• Is there a reason? Can someone explain, in plain language, how A would cause B?
• How big is the sample? Eight games prove very little.
• Was it tested on data it wasn’t built from? A pattern that only works on the history it was found in is not tested yet.
• What else could explain it? Is there a third factor driving both?
• How many things were tried? If thousands of patterns were checked, a few will look good by luck alone.
And GTA 7? It is hard to see it arriving before the mid-2030s if the gap resembles the 13 years between V and VI, and by then Australia will have had several elections. Don’t plan around it.
If you are weighing up an investment or strategy because of how it has performed in the past, we can help you test what is actually behind the numbers before you commit. That is a conversation we are happy to have.
• Variety Australia: GTA 6 release date
• Sportskeeda: GTA release dates
• Wikipedia: Howard government
• Wikipedia: Rudd government (2013)
• Wikipedia: Abbott government
• Engadget: GTA V release date moved to September 2013
• The Nerd Stash: GTA release dates and delays
• ACSH: Hill’s criteria, determining causality from correlation
• Wikipedia: Bradford Hill criteria
• Leinweber: Stupid Data Miner Tricks (1995)
• Motley Fool: Getting rich on sheep, butter and cheese
• InvestmentNews: Market bets based on the Super Bowl
• AARP: The Super Bowl stock indicator
• Interactive Brokers: The not-so-super Super Bowl indicator



This website may contain general advice, but does not take into account your objectives, financial situation or needs. You should consider whether the advice is suitable for you and your personal circumstances. Before you make any decision about whether to acquire a certain product, you should obtain and read the relevant product disclosure statement. In the event that Funded Futures Financial Services is providing personal advice it will be communicated via a ‘statement of advice’.
Funded Futures Financial Planning ABN 81 646 656 804 T/A Funded Futures Financial Services is a Corporate Authorised Representatives and is authorised through Cobalt Advisers Pty Ltd ABN 64 628 654 099 who is an Australian Financial Services Licencee # 512550.
© 2024 Funded Futures | All Rights Reserved | Developed by
